
1. Principles
Three rules guide every number in TheAngel.
- 1Cash and paper value are never added together without a label.
- 2The last round is evidence, not automatic fair value.
- 3Every number can be traced to the events and marks behind it.
2. Ownership after dilution
Your ownership of a company is the figure you record: your percentage when you invest, and again after each round you log. TheAngel shows the latest figure you entered. The SAFE dilution calculator works the conversion out for you, with the formulas below.
A SAFE converts at whichever of its terms gives you the most shares: the cap, the round price less the discount, or the round price itself. You get the better of the cap and the discount, never both.
Ownership at conversion, post-money SAFE
Investment ÷ Post-money cap
Ownership at conversion, pre-money SAFE
Investment ÷ (Pre-money cap + Investment + Other SAFEs converting)
Ownership after a round
Ownership at conversion × (1 − New money ÷ Post-money − Pool increase)
With a post-money SAFE the cap includes every SAFE converting alongside yours, so other SAFEs do not reduce your share. With a pre-money SAFE they do, because they convert into new shares on top of the cap. Each later round, and each increase in the option pool, dilutes everyone who held shares before it. A cap only helps if it prices a share below the round price.
Worked example
$25,000 on a post-money SAFE, $5,000,000 cap, no discount. The next round raises $3,000,000 at $12,000,000 pre-money, with a 5% pool increase.
- Converts at
- the cap, $5,000,000
- Ownership at conversion, 25,000 ÷ 5,000,000
- 0.500%
- New money, 3,000,000 ÷ 15,000,000
- 20%
- Kept by existing holders, 1 − 0.20 − 0.05
- 75%
- Ownership after the round, 0.500% × 0.75
- 0.375%
- Stake at the round price, 0.375% × 15,000,000
- $56,250
3. Performance metrics
Paid in is every investment you made. Distributed is every amount of cash returned to you. Residual value is the sum of your current marks on the positions you still hold, with a position you have not marked counted at cost.
DPI, cash only
Distributed ÷ Paid in
RVPI, paper only
Residual value ÷ Paid in
TVPI, cash plus paper
(Distributed + Residual value) ÷ Paid in
XIRR
Rate r where Σ Cash flowᵢ ÷ (1 + r)^(daysᵢ ÷ 365) = 0
DPI is cash only. TVPI and XIRR include paper value, so they change when your marks change. XIRR uses an actual/365 day count and treats residual value as if received on the as-of date. It is not shown until your first cash flow is at least twelve months before the as-of date, because annualising a short period misleads, or when no rate fits the flows.
Worked example
$25,000 invested on 15 January 2020 and $25,000 on 1 June 2021. $10,000 returned on 1 March 2024. Remaining holdings marked at $80,000 on 1 October 2026.
- Paid in
- $50,000
- DPI, 10,000 ÷ 50,000
- 0.20x
- RVPI, 80,000 ÷ 50,000
- 1.60x
- TVPI, (10,000 + 80,000) ÷ 50,000
- 1.80x
- XIRR, residual dated 1 October 2026
- 10.8%
4. Vintage
A position’s vintage is the year you made that investment. A follow-on cheque is a position of its own, with its own vintage. On Portfolio you can filter every figure by vintage. On Companies you can filter or group by vintage, and a company sits under the year of its first cheque.
Young and mature positions are not comparable: a 2025 position at 1.0x says little, a 2019 position at 1.0x says a lot.
5. Marks and mark policy
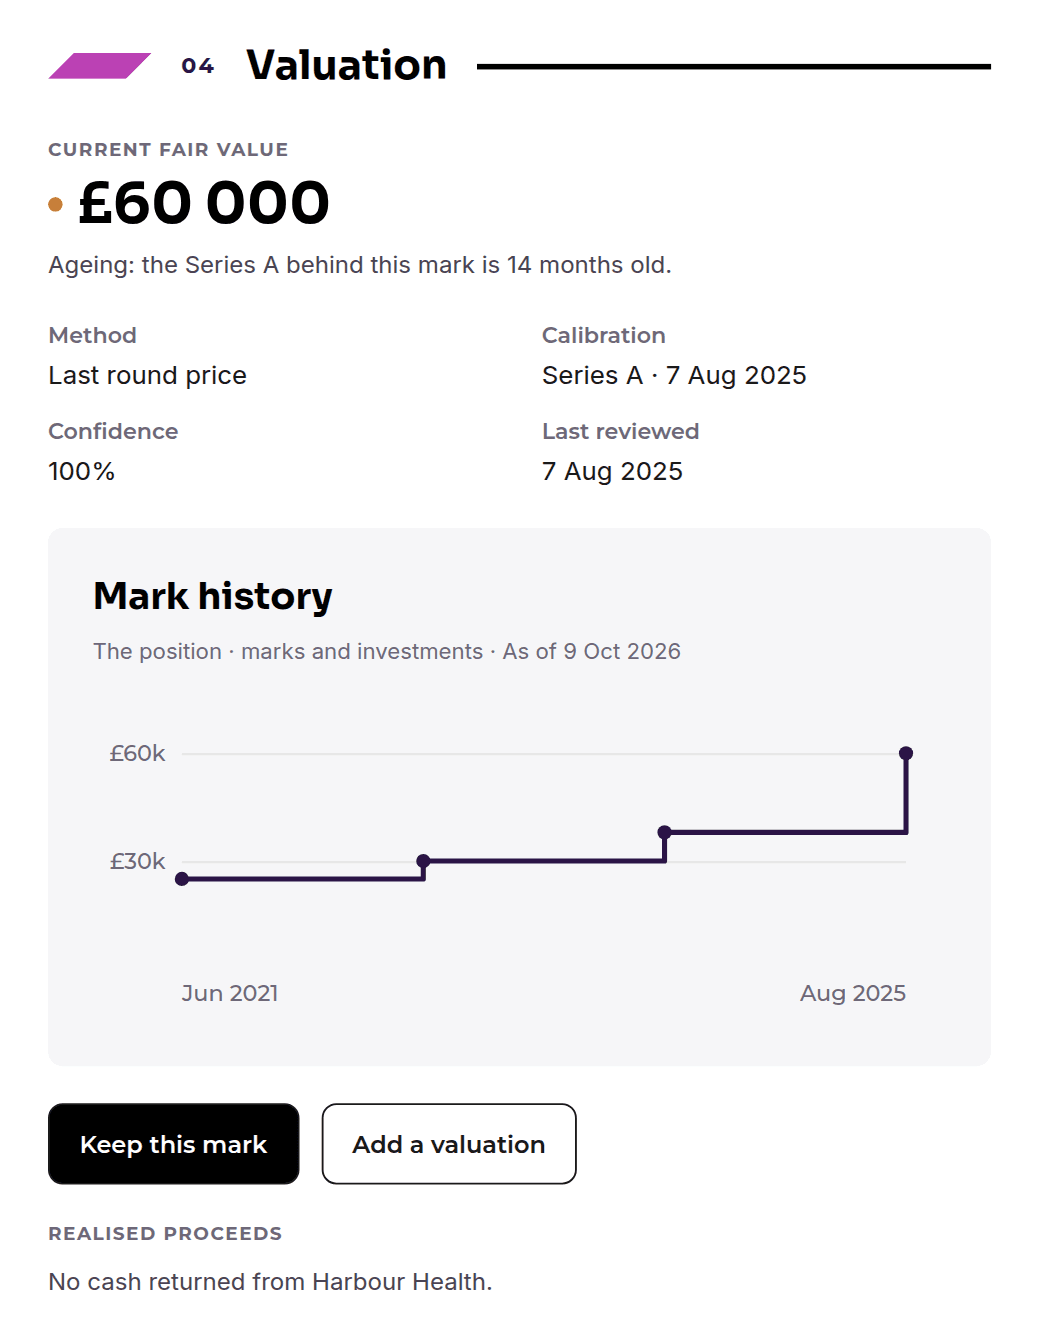
You set each mark. A position you have not marked is shown at cost. Each mark records its date, its value and your confidence in it, and, if you add one, a note of where the figure came from. A correction is a new mark, so the history is kept, not overwritten.
Internal estimates
A mark you enter is labelled Your valuation. It is always shown as an internal estimate, however recent, because no financing round sits behind it.
Confidence
Confidence is recorded as a percentage with each mark. The form offers 100% (certain, from a priced round), 70% (fairly confident) and 40% (a rough estimate). The current mark’s confidence is shown with its value on the company page.
Mark age
A value backed by a financing round is banded by the age of that round. These are the app’s defaults.
Some events never justify an upward mark: an internal SAFE, an insider-only bridge, or a term sheet that has not been signed.
6. Write-downs and write-offs
Marks fall as well as rise. Consider a write-down when any of these signals appear, in a founder update, in the Feed or anywhere else:
- Missed plan
- Short runway
- Failed financing
- Down round
- Founder departure
- Shutdown
To write a position off, mark it at zero. It stays in your register, and in paid in, so your returns stay honest.
7. Exits and preferences
At an exit, proceeds pass through the preference stack before common holders are paid. Preferences are paid in order of seniority, and rounds with equal seniority share pro rata to their preferences. A round that can choose takes its preference or converts, whichever pays it more, and those choices are solved together. What remains is shared by the common holders and every round that converted or participates.
Your proceeds
Your ownership ÷ Your class’s ownership × What your class receives
TheAngel records the preference terms you enter on a position. It does not model exit proceeds on your positions.
8. What we do not calculate
These are out of scope today. Export your data if you need them.
- TaxSEIS and EIS dates are tracked: the three-year date, the certificate and relief at the scheme rate. Gains, losses and tax advice are not.
- Fees and carrySyndicate fees and carried interest are not included in any figure.
- Exit proceedsExits are not modelled on your positions. Record what you receive as a distribution.
- Historical exchange ratesTotals, cash returned and XIRR are converted into your main currency at today’s rates, not the rate on the day. Where a rate is missing, each currency is shown separately.
- Holding entitiesOne portfolio per account. Multiple entities are not combined.
9. Sources
The principle that a recent round is evidence, not automatic fair value, comes from public guidance on valuing private holdings.